Sunday, September 18, 2011

Monday, September 12, 2011
Transport of Water: Mechanism
1. Two theories to explain water + minerals transport in plants
- root pressure theory
- cohesion-tension theory.
2. Root-pressure theory:
- accumulation of mineral ions in the xylem
- enhances water molecules to move into root hairs (by osmosis).
- water pressure ↑ builds up in the root
- pressure pushes up water + dissolved minerals
- through the xlem
- toward the top of the plant.
- but not strong enough to push up water to the top of tall trees.
 |
| Root pressure |
3. In small plants:
- root pressure can build high enough
- to force water and minerals completely out of the tips of the leaves
- the process = guttation.
4. Cohesion-tension theory suggests that:
- water inside the xylem is pulled upward
- by the -ve pressure (or tension)
- that extends all the way from leaves to roots.
5. In the leaf xylem:
- -ve pressure (tension) builds
- as water evaporates during transpiration.
- evaporated water is continually replaced
- thus cohesive bond pull the string of water molecules up
- to create a transpiration pull.
- transpiration pull is relayed
- molecule by molecule
- down the entire column of water in the xylem.
 |
| Transpirational pull in the leaf |
6. In the stem, water molecules:
- exist as a long unbroken chain in the xylem.
- are pulled upwards by tensions produced (during transpiration).
- are held by cohesion + adhesion forces
 |
| Cohesion and adhesion forces in the xylem |
7. Transpiration pull:
- can extend down to the roots
- only through an unbroken chain of water molecules.
8. At the cellular level:
- the gradients of water potential
- drive the osmostic movement of water
- from cell to cell
- within the roots up to the leaves.
 |
| Water potential in leaf, stem and root |
Transport of Water: Concept
1. Dissolved substances (inside a plant cell) = contribute to solute potential (ψs).
2. More solute molecules present --> the lower is the water potential (ψ).
3. When water pontential is lower than> external solution:
- water molecules move into the cell .
- pressure inside the cell increases
- sell contents press against the cell wall
- create a pressure potential (ψs).
4. Water potential (of a plant cell) = solute potential + pressure potential.
5. Water potential = free energy of water.
6. By convention, water potential of pure water = 0 megapascal (MPa).
7. Water will move:
- from a region of higher (less -ve) water potential
- to a region of lower (more -ve) water potential.
8. In plasmolysed cell:
- pressure potential = zero
- water potential = solute potential.
9. As more water molecules enter a cell
- pressure potential ↑ increases
- so is its water potential ↑
- cell becomes turgid.
- less and less water molecules enter the cell.

10. Most minerals
- are actively transported into the root.
- there is a gradient of successfully
- lower water potentials from root hair to the xylem vessels
- result in water uptake by osmosis is enhanced.
11. Water moves by osmosis in the roots follows three pathways:
- apoplast
- symplast
- vacuole.
12. Apoplastic pathway:
- water travels along the cell wall
- and extracelular spaces.
 |
| Apoplast pathway |
13. Symplastic pathway:
- water moves across the cytoplasm of one cell to the next
- across the plasma membrane
- through the plasmodesmata.
 |
| Symplast pathway |
14. Vacuole pathway:
- water moves from vacuole to vacuole of one cell to the next
- across the plasma membrane
- through the plasmodesmata.
 |
| Vacuole pathway |
Tuesday, July 19, 2011
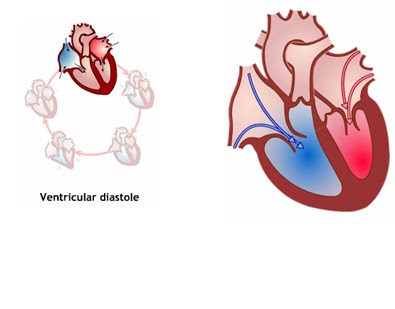


Cardiac Cycle
1. Heart contracts + relaxes in a rhythmic cycle.
2. Cardiac cycle consists of alternating periods of :
· Systole - contraction phase.
· Diastole - relaxation phase.
3. Cardiac cycle = one complete sequence of systole + diastole
4. Resting adult - cardiac cycle repeated 72 times per minute = resting heart rate.
5. Pulse = causes by elastic recoil of arteries.
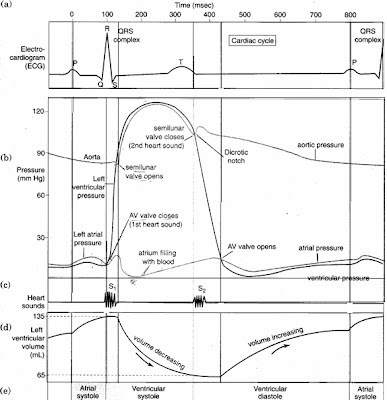
6. Ventricular pressure + aortic pressure + ventricular volume:
- changes (in response to the events that occur)
- at different phases of cardiac cycle.
7. During diastole:
- pressure↓of heart chambers decreases
- volume↑ increases (as blood is pumped in).
8. During systole:
- pressure↑of heart chambers increases
- volume↓ decreases (as blood is pumped out).
9. When aortic pressure > ventricular pressure
à semilunar valves shut + vice versa.
10. When ventricular pressure > atrial pressure
à AV valves shut + vice versa.
11. Valves = ensure blood only flows in right direction.

Tuesday, July 12, 2011
Transport In Animals
1. Human heart :
- consists of 4 chambers : right atrium, right ventricle, left atrium and left ventricle.
- pump blood to all parts of the body.
- made up of cardiac muscle.
 |
| Front/venrtral view of heart |
2. Superior vena cava
--> carries deoxygenated blood
--> from the head + arms
--> into right atrium.
--> carries deoxygenated blood
--> from the head + arms
--> into right atrium.
3. Inferior vena cava
--> carries deoxygenated blood
--> from the lower body + legs
--> into right atrium
--> carries deoxygenated blood
--> from the lower body + legs
--> into right atrium
4. Right atrium
--> receives deoxygenated blood
--> from vena cava
--> to right ventricle.
--> receives deoxygenated blood
--> from vena cava
--> to right ventricle.
5. Tricuspid (antrioventricular) valves
--> prevent blood (from right ventricle) flowing backwards
--> to the right atrium.
--> prevent blood (from right ventricle) flowing backwards
--> to the right atrium.
6. Right ventricle
--> pumps blood
--> to lungs
--> via pulmonary arteries.
--> pumps blood
--> to lungs
--> via pulmonary arteries.
7. Semilunar valves
--> prevent blood (from pulmonary arteries)
--> from flowing backwards
--> into right ventricle.
--> prevent blood (from pulmonary arteries)
--> from flowing backwards
--> into right ventricle.
 |
| Cross-section of heart |
8. Pulmonary artery branches --> carries deoxygenated blood --> from right ventricle --> to lungs. 9. Pulmonary vein --> carrying oxygenated blood --> from lungs --> to left atrium. 10. Left atrium --> receives oxygenated blood --> from lungs --> to left ventricle. 11. Bicuspid (atrioventicular) valves -- > prevent blood (from left ventricle) flow backwards to left atrium 12. Left ventricle --> pumps oxygenated blood --> to body tissue (via aorta). 13. Semilunar/aortic valves --> prevent blood (from aorta) flowing backwards (into left ventricle). 14. Aorta --> carries oxygenated blood --> from left ventricle --> to the rest of the body. 15. Septum separates the right and left side of the heart.  |
| Simplified version of heart |
Saturday, May 14, 2011
Gaseous Exchange in Mammals
(A) Gaseous exchange in mammals
- Respiratory tract consists of: nostril, nasal cavity, pharynx, trachea, bronchi + bronchioles.
- Gaseous exchange occurs at the alveoli.
- Alveolar wall = single layer of squamous epithelium cells.
- Capillary wall = flattened endothelial cells.
- Thin layer of alveolar wall + rich network of blood capillaries à enhance gaseous exchange between alveolar sac + blood.
- Deoxygenated blood - enters the lungs - thrugh pulmonary arteries.
- Oxygenated blood - leaves the lungs - through pulmonary vein.
- The rate of O2 + CO2 diffusion in the alveolar à depends on partial pressure of the gases in the alveolar air.


9. In the lung:
à PO2 in the alveolar air is higher than blood
à O2 diffuse rapidly from alveolus
à to blood plasma.
- In the peripheral tissues:
à PO2 is lower than blood
à O2 diffuses out from blood
à to tissues.
- O2 + CO2 à low solubility in blood plasma
- CO2 à mainly transported as hydrogen carbonate ion (HCO3+).
- In the tissues
à PCO2 is higher than blood
à CO2 diffuses out
à into the capillaries.
(B) Gaseous exchange in mammals
- Blood carries CO2 in 3 forms:
· dissolved gas (8%)
· HCO3- ion in the plasma (73%)
· carbamino haemoglobin in the red blood cells (19%)
- A large amount of CO2
· combines with H2O in the red blood cells (RBC)
· to form carbonic acid (H2CO3)
· then ionizes to form H+ + HCO3-
- HCO3- from the red blood cell:
· diffuse out into the plasma.
· loss of negatively charge HCO3- from the red blood cell
· balanced by the inward diffusion of -ve chloride ions (Cl-) = chloride shift.
- In the lungs.
à PCO2 is lower than in the blood.
à CO2 diffuses out
à into alveoli.
- In the plasma:
1. dissolved CO2 diffuses out into the alveolar air.
2. Carbamino haemoglobin:
à dissociates
à form CO2 + haemoglobin.
3. Hydrogen carbonate ions (HCO3-):
à diffuse into the red blood cells
à reacts with H+
à form carbonic acid (H2CO3).
à dissociates
à form H2O + CO2
à CO2 diffuses out into the alveolar air
à exhaled.
(C) Gaseous exchange in mammals
1. O2 = transported by the haemoglobin molecule in the red blood cells.
2. Each haemoglobin molecule à carries 4 mol of O2.
3. Each polypeptide chain contains:

· 2 subunits of alpha polypeptides chains
· 2 subunits of beta polypeptides chains.
4. Haem:
à prosthetic group of haemoglobin.
à as a porphyrin ring with a ferum ion (Fe2+) in the middle.
à each capable of carrying a single O2 molecule attached to the ferum ion
à porphyrin ring shows strong cooperative O2 binding to the haemoglobin.

5. When one mol of O2 binds to one of the haem group in the haemoglobin
à produces a conformational change in that subunit
à transmitted to the other 3 subunits
à facilitate O2 binding to the rest of the polypeptide.
à concerted conformational change of the subunits
à increases affinity of haemoglobin for O2
à resulting in sigmoid shape for the O2 dissociation curve of the haemoglobin.
6. The cooperative effect is reversible
à when one subunit of oxyhaemoglobin unloads its O2,
à other three quickly follow suit
à conformational change
à lowers its affinity for O2.
7. Relationship between PO2 and % saturation of haemoglobin with O2
à represented by O2 dissociation curve = sigmoid.
à represented by O2 dissociation curve = sigmoid.

8. The O2 dissociation curve shows:
à when haemoglobin is exposed to a gradual increase of PO2,
à it absorbs O2 rapidly at first
à but more slowly as the PO2 continues to rise.
9. The % of O2 saturation of haemoglobin = 95%
à when blood flows through the lungs (PO2 = 105 mmHg).
10. The % of O2 saturation of haemoglobin = 70%
à when blood flows through a moderately active/resting muscle (PO2=40 mmHg).
11. As the blood from the lungs reaches the muscle at rest:
à 25% of the O2 carried in the heamoglobin is unloaded to the surrounding tissues
à for cellular respiration.
à 70% of the oxygen is still retained by the haemoglobin.
12. The % of O2 saturation of haemoglobin is 40%
à when the blood flows through the active muscle at PO2 of 20 mmHg.
13. When the muscle is active:
à haemoglobin readily unloads 55% of the oxygen
à still retains 40%.

14. During exercise:
à active tissue is in demand for O2 to produce energy.
à slight drops in PO2 (between muscle at rest + muscle during exercise.)
à enough to cause a relatively large increase in the amount of O2 the blood unloads.
15. The increase of CO2 conc/decrease in blood pH:
à will induce haemoglobin to unload more O2.
à affinity of haemoglobin to O2 is lower.
à O2 dissociation curve shifts to the right = Bohr effect.

16. Foetal haemoglobin:
à has a higher affinity for O2 than the maternal haemoglobin
à therefore, O2 dissociation curve lies to the left.
17. O2 must easily dissociate from the maternal haemoglobin to the foetal haemoglobin
à therefore, easily transferred from maternal to foetal blood.

18. Myoglobin:
à higher affinity for O2 than haemoglobin.
à Therefore, dissociation curve lies to the left.
Haemoglobin:
à has a lower affinity for O2 than myoglobin.

19. In the muscle:
à O2 dissociates from haemoglobin
à transferred to myoglobin to be stored.


Subscribe to:
Posts (Atom)